CarSensor Used Car Data Analysis
Introduction
Code for Web Content Extraction
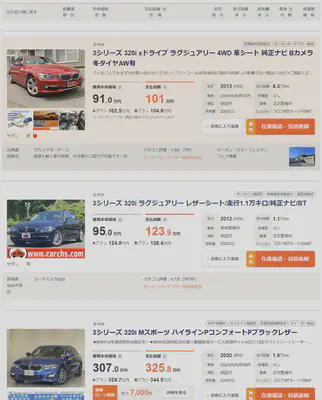
(This is how the results are displayed)
Here’s the step-by-step process I conceived to extract detailed car information:
1. Input the link to the search results page in the code and execute it.
2. The code first determines the total number of result pages, which will then help in defining the number of loops and iterating over each results page.
3. For each results page, the code will traverse every car’s detail page, extract the car information, and save it to a CSV file.
Since the car information can be extracted from the HTML, I used BeautifulSoup for the scraping.
Basic Vehicle Information Extraction
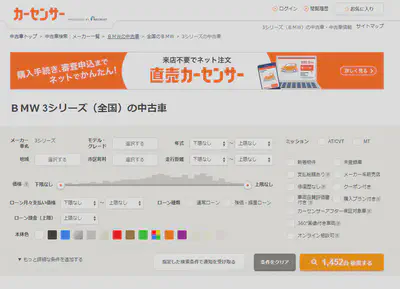
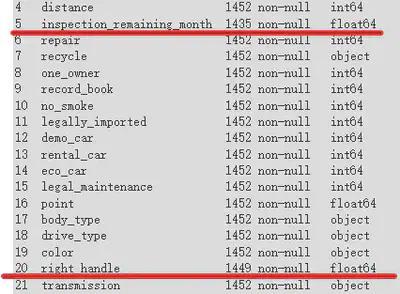
At the top of the details page, there’s a table as illustrated below, from which we can extract the basic information of the vehicle. Based on my previous experience, this information is basically what has the most impact on the price of the car.
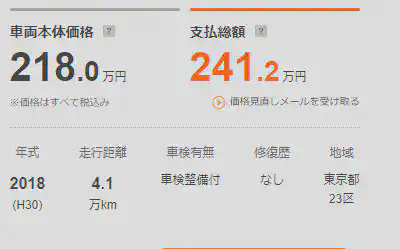
Each piece of information in the table has its associated path, so using BeautifulSoup’s CSS selector makes extraction feasible. Strings such as the era written in the Japanese calendar mentioned in parentheses after the model year and the “万km” after the mileage might be cumbersome to deal with in subsequent data analyses. Thus, I intend to handle these details during the extraction phase. The specific treatments are as follows:
Price: The base price is directly stored as a numeral in the CSS. All that’s needed is to remove the commas to turn it into a numeric type. The standard format for the total price is either “numeral+万円” or just “— 万円.” In this case, remove “万円” and store the numeral after multiplying it by 10000. Any entry without a stated total price is set to 0.
if key == 'base_price':
  data[key] = element.get('content').replace(",", "")  # remove comma from the number
elif key == 'total_price':
  price_text = element.text.strip()  # remove leading/trailing whitespaces
    if price_text == "---万円":
      data[key] = "0"
    else:
      # remove '万円' and convert to the required format
      price_text = price_text.replace('万円', '')
      price_float = float(price_text) * 10000  # convert '万' to actual number
      data[key] = str(int(price_float))  # convert it to string without comma
Mileage: This is similar to the price, just need to remove the extra strings at the end and convert the unit.
elif key == 'distance':
    distance_float = float(element.text) * 10000
    data[key] = str(int(distance_float))
Vehicle Inspection: The way vehicle inspections are presented on the website is slightly complex. Some entries only state “with inspection” or “without inspection,” while others are formatted as “YYYY (Japanese calendar YY) MM.” I believe what affects the vehicle’s price is the remaining duration of the vehicle inspection. So, I plan to store the information on the remaining months. First, determine if it’s “with inspection” or “without inspection” and record as 24 and 0 respectively. For other content, extract just the year and month numbers and compute the remaining duration based on the current date.
elif key == 'inspection_remaining_month':
    inspection_elements = element.select('p')
    if len(inspection_elements) >= 2:
        inspection_text = inspection_elements[1].text
        if inspection_text == "車検整備付":
            data[key] = "24"
        elif inspection_text == "車検整備無":
            data[key] = "0"
        elif len(inspection_elements) >= 3:
            year_month_text = inspection_elements[1].text + inspection_elements[2].text
            # Use a regular expression to extract the year and month
            match = re.match(r'(\d{4})\(R\d{2}\)年(\d{1,2})月', year_month_text)
            if match:
                year = int(match.group(1))
                month = int(match.group(2))
                # Calculate the difference in months
                now = datetime.datetime.now()
                diff = (year - now.year) * 12 + month - now.month
                data[key] = str(diff)
            else:
                data[key] = year_month_text
    else:
        data[key] = None
Repair History: Since there are only two types - repaired or not repaired - it’s stored directly as 1 and 0.
elif key == 'repair':
    if element.text == 'なし':
        data[key] = 0
    elif element.text == 'あり':
        data[key] = 1
    else:
        data[key] = element.text
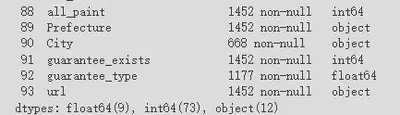
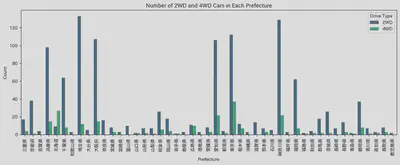
Region: I’m not sure about the extent to which the region affects the price. However, I’ve heard before that in regions like Hokkaido, where there’s abundant snow, the vehicle undercarriage tends to rust, making the cars cheaper. Hence, I’d like to verify this practically this time. The location data is formatted as “Prefecture + City/Town/Village.” Since not all sellers specify the “City/Town/Village,” I plan to categorize the location into two columns: “Prefecture” and “City.”
elif key == 'region':
    # Split the text by the <br/> tag and save each part to the corresponding column.
    region_parts = element.decode_contents().split('<br/>')
    data['Prefecture'] = region_parts[0].strip() if len(region_parts) > 0 else None
    data['City'] = region_parts[1].strip() if len(region_parts) > 1 else None
Vehicle Condition Information Extraction
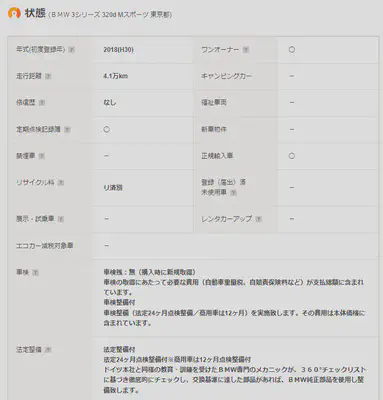
elif key in ['one_owner', 'record_book', 'new_car', 'no_smoke', 'registered', 'legally_imported',
             'demo_car', 'rental_car', 'eco_car', 'camping', 'welfare']:
    # If the text is '◯', store 1, otherwise store 0.
    data[key] = '1' if element.text.strip() == '◯' else '0'
elif key == 'legal_maintenance':
    # Check if the text is "法定整備付", "法定整備無", or "法定整備別" and store 1, 0, or 2 accordingly.
    text = element.text.strip()
    if '法定整備付' in text:
        data[key] = '1'
    elif '法定整備無' in text:
        data[key] = '0'
    elif '法定整備別' in text:
        data[key] = '2'
    else:
        data[key] = None
elif key == 'guarantee':
    # Check if the text contains "保証付" or "保証無", and "ディーラー保証" or "販売店保証".
    text = element.text.strip()
    if '保証付' in text:
        data['guarantee_exists'] = '1'
        if 'ディーラー保証' in text:
            data['guarantee_type'] = '1'
        elif '販売店保証' in text:
            data['guarantee_type'] = '0'
    elif '保証無' in text:
        data['guarantee_exists'] = '0'
        data['guarantee_type'] = None
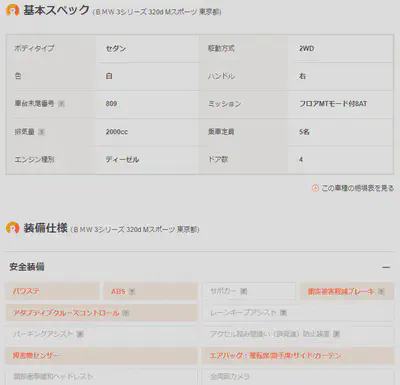
Specifications and Equipment Information Extraction
For equipment details, I can generally use 0 and 1 for storage. If there’s a subdivision within a particular equipment, I use the format “EquipmentName_SubdivisionEquipment” as the column name and store the data as 0 and 1. This portion of the code is quite long, so I’ve omitted it.
Automated Extraction of Vehicle Information
(At that moment, the total count was 1,452)
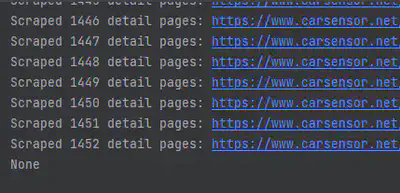
(The code execution result shows successful extraction of information for 1,452 vehicles.)
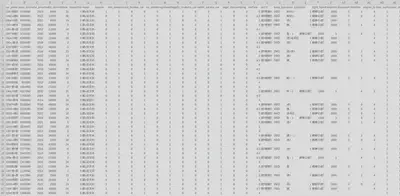
Data Analysis
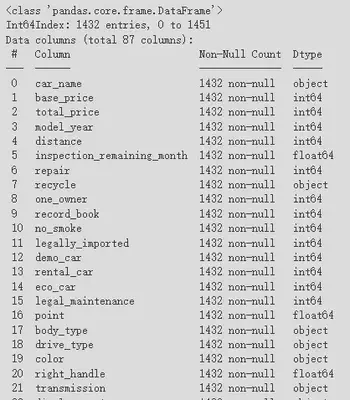
Data Cleaning
import pandas as pd

df = pd.read_csv('data.csv', encoding='utf-8')

# Replace non-breaking spaces in the DataFrame with regular spaces
df = df.replace('\xa0', ' ', regex=True)
df.to_csv('car_price.csv', encoding='cp932', index=False)
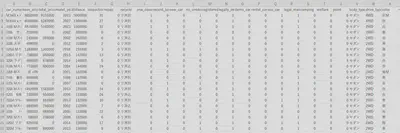
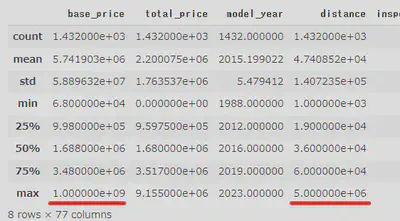
In Colab, I began by loading the data using Pandas. Using the info() method to view data details, I confirmed that 1,452 rows and 106 columns had been successfully loaded.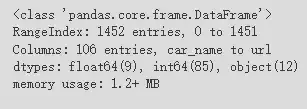

Data Visualization and Analysis
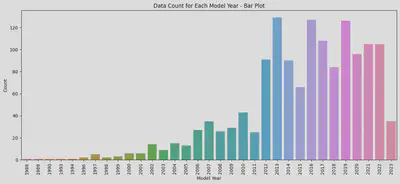
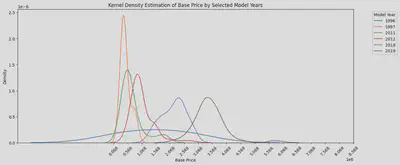
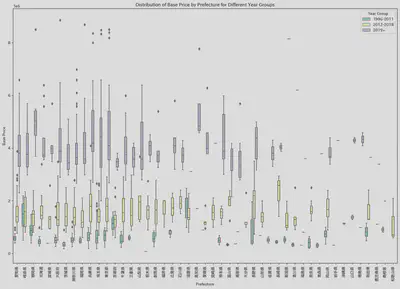
・Relationship between Vehicle Model Year and Price
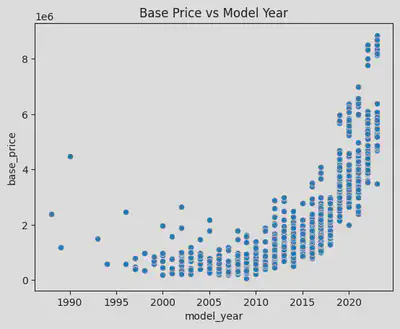
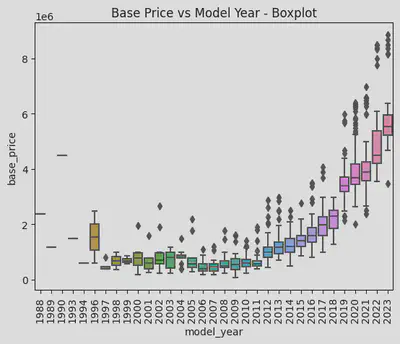
I plotted a KDE curve for the aforementioned years with noticeable price differences, and it’s evident that the peak prices between 2012, 2018, and 2019 vary significantly, with a difference of over a million yen. This corroborates my earlier observation: the current model is the priciest, the previous generation is slightly cheaper, and the older models are the least expensive, albeit with minimal differences.
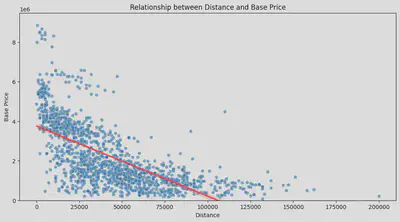
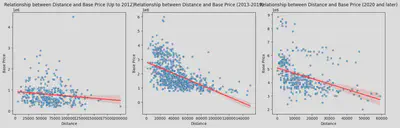
・Relationship between Mileage and Price
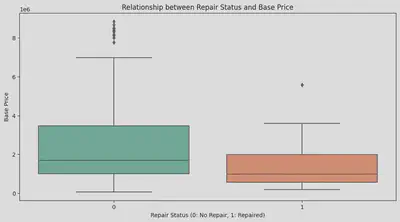
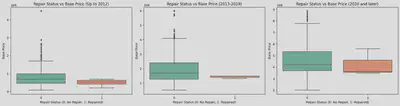
・Relationship Between Repair History and Price
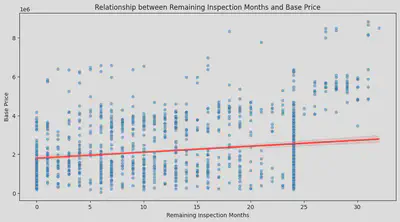
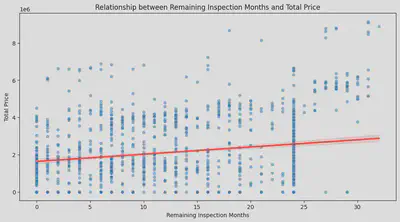
・Relationship Between Remaining Vehicle Inspection and Price
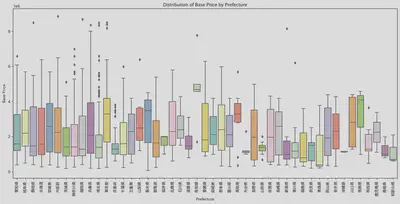
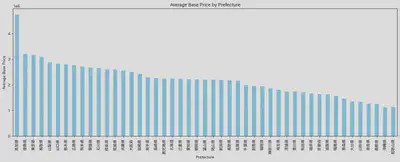
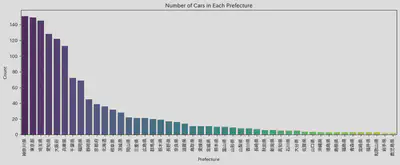
・Relationship Between Region and Price
(Aside about Region)
・Analysis of the Impact of All Factors on Price
# Set the target variable
y = df['base_price']

# Select the features to consider and exclude explicitly mentioned columns
features_to_consider_final = [
    col for col in df.columns.tolist()
    if col not in ['car_name', 'total_price', 'guarantee_type', 'base_price', 'year_group']
]

X_final = df[features_to_consider_final].copy()

# Identify categorical features in the dataset
categorical_features_final = [col for col in features_to_consider_final if df[col].dtype == 'object']

# Initialize the scaler and label encoder
scaler = StandardScaler()
le = LabelEncoder()

# Standardize 'distance' and 'model_year'
X_final[['distance', 'model_year']] = scaler.fit_transform(X_final[['distance', 'model_year']])

# Convert categorical features using LabelEncoder
for col in categorical_features_final:
    X_final[col] = le.fit_transform(X_final[col])

# Train the model using Random Forest
random_forest_regressor_final = RandomForestRegressor()
random_forest_regressor_final.fit(X_final, y)

# Get and sort feature importances
feature_importances_final = random_forest_regressor_final.feature_importances_
feature_importances_final_df = pd.DataFrame({
    'Feature': features_to_consider_final,
    'Importance': feature_importances_final
}).sort_values(by='Importance', ascending=False)

# Print each feature and its corresponding importance
for index, row in feature_importances_final_df.iterrows():
    print(f"{row['Feature']}: {row['Importance']*100:.2f}%")
- model_year: 80.55%
- displacement: 8.49%
- inspection_remaining_month: 3.70%
- distance: 2.01%
- transmission: 0.63%
- turbo: 0.52%
- Prefecture: 0.50%
- engine_type_gasoline: 0.26%
- color: 0.24%
- right_handle: 0.19%
Conclusion
This data analysis to some extent corroborates my previous experience, mainly:
- Model year, mileage, and vehicle inspection significantly impact the price.
- Model changes lead to concentrated price ranges.
- The region has a certain impact on the price.
There are also many unexpected results for me:
- Displacement has a considerable impact on the price.
- Repair history does not have a large impact on the price.
- The factors affecting regional prices are not as I previously thought.
- For older models, the impact of mileage is not significant.
During the analysis process, I also found many areas for improvement:
- The handling of outliers during data scraping is not thorough enough.
- This analysis targets only one type of vehicle. If necessary to compare more models in the future, appropriate improvements are needed.
- The data captured is not real-time. Sites like CarSensor may upload new vehicle information at any time. Although the updated vehicle information within one day has little effect on this analysis based on thousands of vehicle information, I hope to achieve real-time monitoring and data extraction in the future.
- Due to time constraints, detailed analysis of vehicle equipment was not conducted this time. For example, with the deepening of the aging problem, features like automatic braking and driving recorders will likely become factors considered when buying a car. More and more used cars with these features will appear in the future, and dealers will definitely consider these elements when pricing. Analysis of vehicle equipment is also content for deeper analysis in the future.
- I hope to create a feature to analyze vehicle data that meets the requirements of different groups in the future. For example, the elderly may need more automatic braking features, so I can analyze which car is good and cheap based on this standard.
After doing so much works, I have more confidence in choosing used cars in the future. I also hope I can buy the most suitable 3-series for myself soon.
(Reference Link: https://www.carsensor.net/usedcar/search.php?CARC=BM_S011)
(The data used in this article is as of 10:30 PM on August 1, 2023. The content pointed to by the link will change from time to time.)